Market Outlook
July 02, 2018
Market Cues
Domestic Indices
Chg (%)
(Pts)
(Close)
Indian markets are likely to open flat tracking global indices and SGX Nifty.
BSE Sensex
1.1
386
35,423
U.S. Stocks pulled back sharply going into the close of trading on Friday. The major
Nifty
1.2
125
10,714
averages showed a notable decline but managed to end the day in positive territory.
Mid Cap
1.8
275
15,451
The Dow Jones ended up by 0.2% to 24,271 and the Nasdaq showed upside move
Small Cap
1.9
302
16,032
by 0.1% to 7,510.
Bankex
0.4
124
29,251
U.K. stocks rose notably on Friday after the Office for National Statistics revised up
its first quarter GDP growth figures to 0.2 percent from 0.1 percent previously and
Global Indices
Chg (%)
(Pts)
(Close)
another report showed growth in the U.K.'s dominant services sector gained
momentum in April. The benchmark FTSE 100 was up by 0.3% to 7,636.
Dow Jones
0.2
55
24,271
Nasdaq
0.1
7
7,510
On domestic front, Indian shares rallied on Friday and the rupee also recovered
FTSE
0.3
21
7,636
from a record low hit in the previous session after China eased restrictions on
foreign investment in several sectors and EU leaders struck a deal on immigration,
Nikkei
0.2
34
22,305
helping investors shrug off trade tensions, albeit temporarily. Oil prices also
Hang Seng
1.6
458
28,955
steadied amid profit taking after recent strong rally on concerns about trade frictions
Shanghai Com
2.2
61
2,847
between the United States and other major economies. The BSE Sensex ended
positive by 1.1% to 35,423.
Advances / Declines
BSE
NSE
News Analysis
Advances
1,831
430
Jindal Steel & Power Limited - CMP `220 Target Price - `350
Declines
768
1,356
Unchanged
146
77
Aurobindo Pharmaceuticals - CMP `601 Target Price - `780
Detailed analysis on Pg2
Volumes (` Cr)
BSE
3,509
Investor’s Ready Reckoner
NSE
29,376
Key Domestic & Global Indicators
Stock Watch: Latest investment recommendations on 150+ stocks
Net Inflows (` Cr)
Net
Mtd
Ytd
Refer Pg5 onwards
FII
59
(3,638)
-5,900
Top Picks
*MFs
616
5,798
65,170
CMP
Target
Upside
Company
Sector
Rating
(`)
(`)
(%)
Blue Star
Capital Goods
Buy
644
867
34.7
Top Gainers
Price (`)
Chg (%)
Dewan Housing Finance
Financials
Accumulate
638
720
12.9
HCC
12
12.4
Parag Milk Foods
Others
Buy
313
410
30.8
JINDALSAW
79
12.4
Bata India
Others
Accumulate
859
948
10.4
KEI Industries
Capital Goods
Buy
409
589
44.2
RELIGARE
52
12.1
More Top Picks on Pg4
EIDPARRY
239
11.5
IDBI
55
10.0
Key Upcoming Events
Previous
Consensus
Date
Region
Event Description
ReadingExpectations
Top Losers
Price (`)
Chg (%)
Jul 02, 2018
Germany PMI Manufacturing
55.90
55.90
DBL
664
-5.0
Jul 02, 2018
US
Initial Jobless claims
227.00
225.00
Jul 04, 2018
UK
PMI Manufacturing
54.40
54.00
REDINGTON
109
-3.7
Jul 05, 2018
Germany PMI Services
53.90
53.90
JISLJALEQS
77
-3.5
Jul 06, 2018
US
Change in Nonfarm payrolls
223.00
200.00
PNBHOUSING
1132
-3.4
More Events on Pg7
GUJGAS
732
-2.9
As on June 29, 2018
Market Outlook
July 02, 2018
News Analysis
Jindal Steel & Power Limited - CMP `220 Target Price - `350
We expect JSPL’s top line to grow at 27% CAGR over FY19-FY20 on the back
of strong steel demand (mostly from real estate, automotive & infra sector)
and completion of capacity addition at Angul plant . On the bottom line front,
we expect JSPL to turn in to profit by FY19 on back of strong operating margin
improvement (due to higher utilization in steel and power segment and
simultaneous reduction in debt level). Along with that, the management
intends to increase the shareholders value either by monetizing some of the
asset or building it to improve the profitability of jspl. We recommend to buy
the stock with a target price of ₹350. Based on peer comparison method, we
value the steel segment on EV/tonne basis and power business on EW/MW
basis.
Key Financials
Segments
Capacity
INR Value INR Cr.
Total INR Cr.
EV -Power (MW)
3,400
Disinvestment
1,000
6.50
6,500
Installed
2,400
5.00
12,000
EV -Steel (MTPA)
10.60
5,000
53,000
Consol Enterprise Value
71,500
Add
CWIP
3,800
Cash
467
Subtotal
75,767
Less
Debt FY18
42,000
Cash
Equity Value
33,767
No of shares
97
Value per share INR
349
Post warrant conversion INR/Share
351
CMP*
220
* 29th June 2018
Upside
59%
Aurobindo Pharmaceuticals - CMP `601 Target Price - `780
Aurobindo Pharmaceuticals is an India-based leading global generic company. It’s
predominately formulations export company, with USA & Europe contributing
~70% of sales (FY2018). Amongst the Indian Pharmaceutical companies, we
believe that Aurobindo Pharmaceuticals is well placed to face the challenging
generic markets, given its focus on achieving growth through productivity. We
expect Aurobindo to report net revenue CAGR of ~13% & net profit to grow at
~5% CAGR during FY2018-20E, due to increased R&D expenditure. However,
valuations of the company are cheap V/s its peers and own fair multiples of 17-
18x. We recommend BUY rating.
Market Outlook
July 02, 2018
Key Financials
Y/E March (` cr)
FY2017
FY2018E
FY2019E
FY2020E
Net sales
14,845
16,233
18,871
20,646
% chg
8.3
9.4
16.3
9.4
Adj. Net profit
2,302
2,423
2,698
2,680
% chg
13.7
5.3
11.3
(0.7)
EBITDA margin (%)
21.5
21.6
21.0
19.2
EPS (`)
39.4
41.5
46.2
45.9
P/E (x)
15.4
14.6
13.1
13.2
P/BV (x)
27.6
23.0
20.8
17.3
RoE (%)
23.1
20.6
20.5
19.5
RoCE (%)
3.8
3.0
2.5
2.1
EV/Sales (x)
2.6
2.4
1.9
1.7
EV/EBITDA (x)
11.9
11.0
9.2
8.7
Economic and Political News
Fiscal deficit hits 55% of full-year target on the back of higher capex
India's external debt went up 12.4% to $529.7 billion in March
Paswan asks states to keep close tabs on prices of perishable commodities
No more bad loans, steel sector crisis is over: Minister Birender Singh
Monsoon eases power demand in UP by 20%, total offtake dips to 17,000 Mw
Corporate News
Irdai allows LIC to buy up to 51% stake in debt-ridden IDBI Bank
NTPC takes equity stake in two Bihar state power projects for Rs 21 billion
Tata Steel hives off Europe biz, inks definitive JV with ThyssenKrupp
Jubilant Foods will have to pay 10% tax on royalty, says ITAT
RIL to acquire Radisys for $74 mn to accelerate Jio's 5G, IoT push
Tata Sons to participate in second round of TCS share buyback
Market Outlook
July 02, 2018
Top Picks
Market Cap
CMP
Target
Upside
Company
Rationale
(` Cr)
(`)
(`)
(%)
Favorable outlook for the AC industry to augur well
for Cooling products business which is out pacing
Blue Star
6,189
644
867
34.7
the market growth. EMPPAC division's profitability to
improve once operating environment turns around.
With a focus on the low and medium income (LMI)
consumer segment, the company has increased its
Dewan Housing Finance
19,997
638
720
12.9
presence in tier-II & III cities where the growth
opportunity is immense.
Well capitalized with CAR of 18.1% which gives
sufficient room to grow asset base. Faster resolution
ICICI Bank
1,77,189
276
416
51.0
of NPA would reduce provision cost, which would
help to report better ROE.
High order book execution in EPC segment, rising
KEI Industries
3,202
409
589
44.2
B2C sales and higher exports to boost the revenues
and profitability
Expected to benefit from the lower capex
Music Broadcast Limited
1,741
305
475
55.7
requirement and 15 year long radio broadcast
licensing.
Strong brands and distribution network would boost
Siyaram Silk Mills
2,423
517
851
64.6
growth going ahead. Stock currently trades at an
inexpensive valuation.
GST regime and the Gujarat plant are expected to
Maruti Suzuki
2,66,471
8,821
10,619
20.4
improve the company’s sales volume and margins,
respectively.
We expect loan book to grow at 24.3% over next
GIC Housing
1,888
351
655
86.8
two year; change in borrowing mix will help in NIM
improvement
Third largest brand play in luggage segment
Increased product offerings and improving
Safari Industries
1,378
618
720
16.5
distribution network is leading to strong growth in
business. Likely to post robust growth for next 3-4
years
Source: Company, Angel Research
Market Outlook
July 02, 2018
Top Picks
Market Cap
CMP
Target
Upside
Company
Rationale
(` Cr)
(`)
(`)
(%)
We expect financialisation of savings and
Aditya Birla Capital
29,320
133
218
63.7
increasing penetration in Insurance & Mutual fund
would ensure steady growth.
One of the leading Indian dairy products
companies in India created strong brands in dairy
products. Rising revenue share of high-margin
Parag Milk Foods
2,636
313
410
30.8
Value Added Products and reduction in interest
cost is likely to boost margins and earnings in next
few years.
We expect MCL to report net revenue CAGR of
~15% to ~`450cr over FY2018-20E mainly due
to strong growth in online matchmaking &
Matrimony.com Ltd
1,637
743
1,016
41.1
marriage related services. On the bottom-line
front, we expect a CAGR of ~28% to `82cr over
the same period on the back margin
improvement.
HDFC Bank maintained its steady growth in the
4QFY18. The bank’s net profit grew by 20.3%.
Steady growth in interest income and other
HDFC Bank
5,48,970
2,108
2,315
9.8
income aided PAT growth. The Strong liability
franchise and healthy capitalisation provides
strong earning visibility. At the current market
price, the bank is trading at 3.2x FY20E ABV.
We expect strong PAT growth on back of healthy
growth in automobile segment (on back of new
launches and facelifts in some of the model ) and
M&M
1,12,788
897
1,050
13.6
strong growth in Tractors segment coupled by its
strong brand recall and improvement in rural
sentiment
Market leader in the room air conditioner (RAC)
outsourced manufacturing space in India with a
market share of 55.4%. It is a one-stop solutions
Amber Enterprises
2,793
935
1,230
38.5
provider for the major brands in the RAC industry
and currently serves eight out of the 10 top RAC
brands in India
BIL is the largest footwear retailer in India, offering
footwear, accessories and bags across brands.
We expect BIL to report net PAT CAGR of ~16% to
Bata India
10,634
859
948
10.4
~`3115cr over FY2018-20E mainly due to new
product launches, higher number of stores
addition and focus on women’s high growth
segment and margin improvement
SHTF is in the sweet spot with benefits from
stronger CV volumes, NIMs unaffected by rising
Shriram Transport Finance
29,532
1,299
1,764
35.5
bond yields on the back of stronger pricing power
and an enhancing ROE by 750bps over FY18-
20E, supported by decline in credit cost.
We expect JSPL’s top line to grow at 27% CAGR
over FY19-FY20 on the back of strong steel
demand and capacity addition. On the bottom
Jindal Steel & Power Limited
220
350
59
line front, we expect JSPL to turn in to profit by
FY19 on back of strong operating margin
improvement.
Source: Company, Angel Research
Market Outlook
July 02, 2018
Fundamental Call
Market Cap
CMP
Target
Upside
Company
Rationale
(` Cr)
(`)
(`)
(%)
CCL is likely to maintain the strong growth
CCL Products
3,594
270
360
33.3
trajectory over FY18-20 backed by capacity
expansion and new geographical foray
We forecast Nilkamal to report top-line CAGR of
~9% to `2,635cr over FY17-20E on the back of
Nilkamal
2,379
1,594
2,178
36.6
healthy demand growth in plastic division. On the
bottom-line front, we estimate
~10% CAGR to
`162cr owing to improvement in volumes.
Elantas Beck India is the Indian market leader in
liquid insulation segment used in electrical
equipments like motors, transformers etc. It derives
Elantas Beck India Ltd
1,653
2,085
2,500
19.9
demand from several industries which are expected
to register 10%+ CAGR in demand in the coming
years.
Greenply Industries Ltd (GIL) manufactures plywood
& allied products and medium density fibreboards
(MDF). GIL to report net revenue CAGR of ~14% to
Greenply Industries
2,861
233
395
69.3
~`2,478cr over FY2017-20E mainly due to healthy
growth in plywood & lamination business on the
back of strong brand and distribution network
GMM Pfaudler Limited (GMM) is the Indian market
leader in glass-lined (GL) steel equipment. GMM is
expected to cross CAGR 15%+ in revenue over the
GMM Pfaudler Ltd
1,166
797
1,020
27.9
next few years mainly led by uptick in demand from
user industries and it is also expecting to increase its
share of non-GL business to 50% by 2020.
L&T Fin’s new management is on track to achieve
L&T Finance Holding
30,266
152
210
38.5
ROE of 18% by 2020 and recent capital infusion of
`3000cr would support advance growth.
Amongst the Indian Pharmaceutical companies, we
believe that Aurobindo Pharmaceuticals is well
placed to face the challenging generic markets,
given its focus on achieving growth through
Aurobindo Pharmaceuticals
601
780
29.8
productivity. We expect Aurobindo to report net
revenue CAGR of ~13% & net profit to grow at
~5% CAGR during FY2018-20E, due to increased
R&D expenditure.
Market Outlook
July 02, 2018
Key Upcoming Events
Global economic events release calendar
Bloomberg Data
Date
Time Country
Event Description
Unit
Period
Last Reported
Estimated
Jul 02, 2018
1:25 PMGermany
PMI Manufacturing
Value
Jun F
55.90
55.90
6:00 PMUS
Initial Jobless claims
Thousands
Jun 30
227.00
225.00
Jul 04, 2018
2:00 PMUK
PMI Manufacturing
Value
Jun
54.40
54.00
Jul 05, 2018
1:25 PMGermany
PMI Services
Value
Jun F
53.90
53.90
Jul 06, 2018
6:00 PMUS
Change in Nonfarm payrolls
Thousands
Jun
223.00
200.00
6:00 PMUS
Unnemployment rate
%
Jun
3.80
3.80
Jul 10, 2018
2:00 PMUK
Industrial Production (YoY)
% Change
May
1.80
7:00 AMChina
Consumer Price Index (YoY)
% Change
Jun
1.80
Jul 11, 2018
US
Producer Price Index (mom)
% Change
Jun
1.00
Jul 12, 2018
India
Imports YoY%
% Change
Jun
14.85
India
Exports YoY%
% Change
Jun
20.18
5:30 PMIndia
Industrial Production YoY
% Change
May
4.90
6:00 PMUS
Consumer price index (mom)
% Change
Jun
0.20
0.20
Jul 13, 2018
7:30 AMChina
Industrial Production (YoY)
% Change
Jun
6.80
Jul 16, 2018
China
Exports YoY%
% Change
Jun
12.60
12:00 PMIndia
Monthly Wholesale Prices YoY%
% Change
Jun
4.43
7:30 AMChina
Real GDP (YoY)
% Change
2Q
6.80
Jul 17, 2018
6:45 PMUS
Industrial Production
%
Jun
(0.09)
2:00 PMUK
Jobless claims change
% Change
Jun
(7.70)
Jul 18, 2018
6:00 PMUS
Housing Starts
Thousands
Jun
1,350.00
6:00 PMUS
Building permits
Thousands
Jun
1,301.00
2:30 PMEuro Zone
Euro-Zone CPI (YoY)
%
Jun F
2.00
2:00 PMUK
CPI (YoY)
% Change
Jun
2.40
Jul 23, 2018
7:30 PMUS
Existing home sales
Million
Jun
5.43
Source: Bloomberg, Angel Research
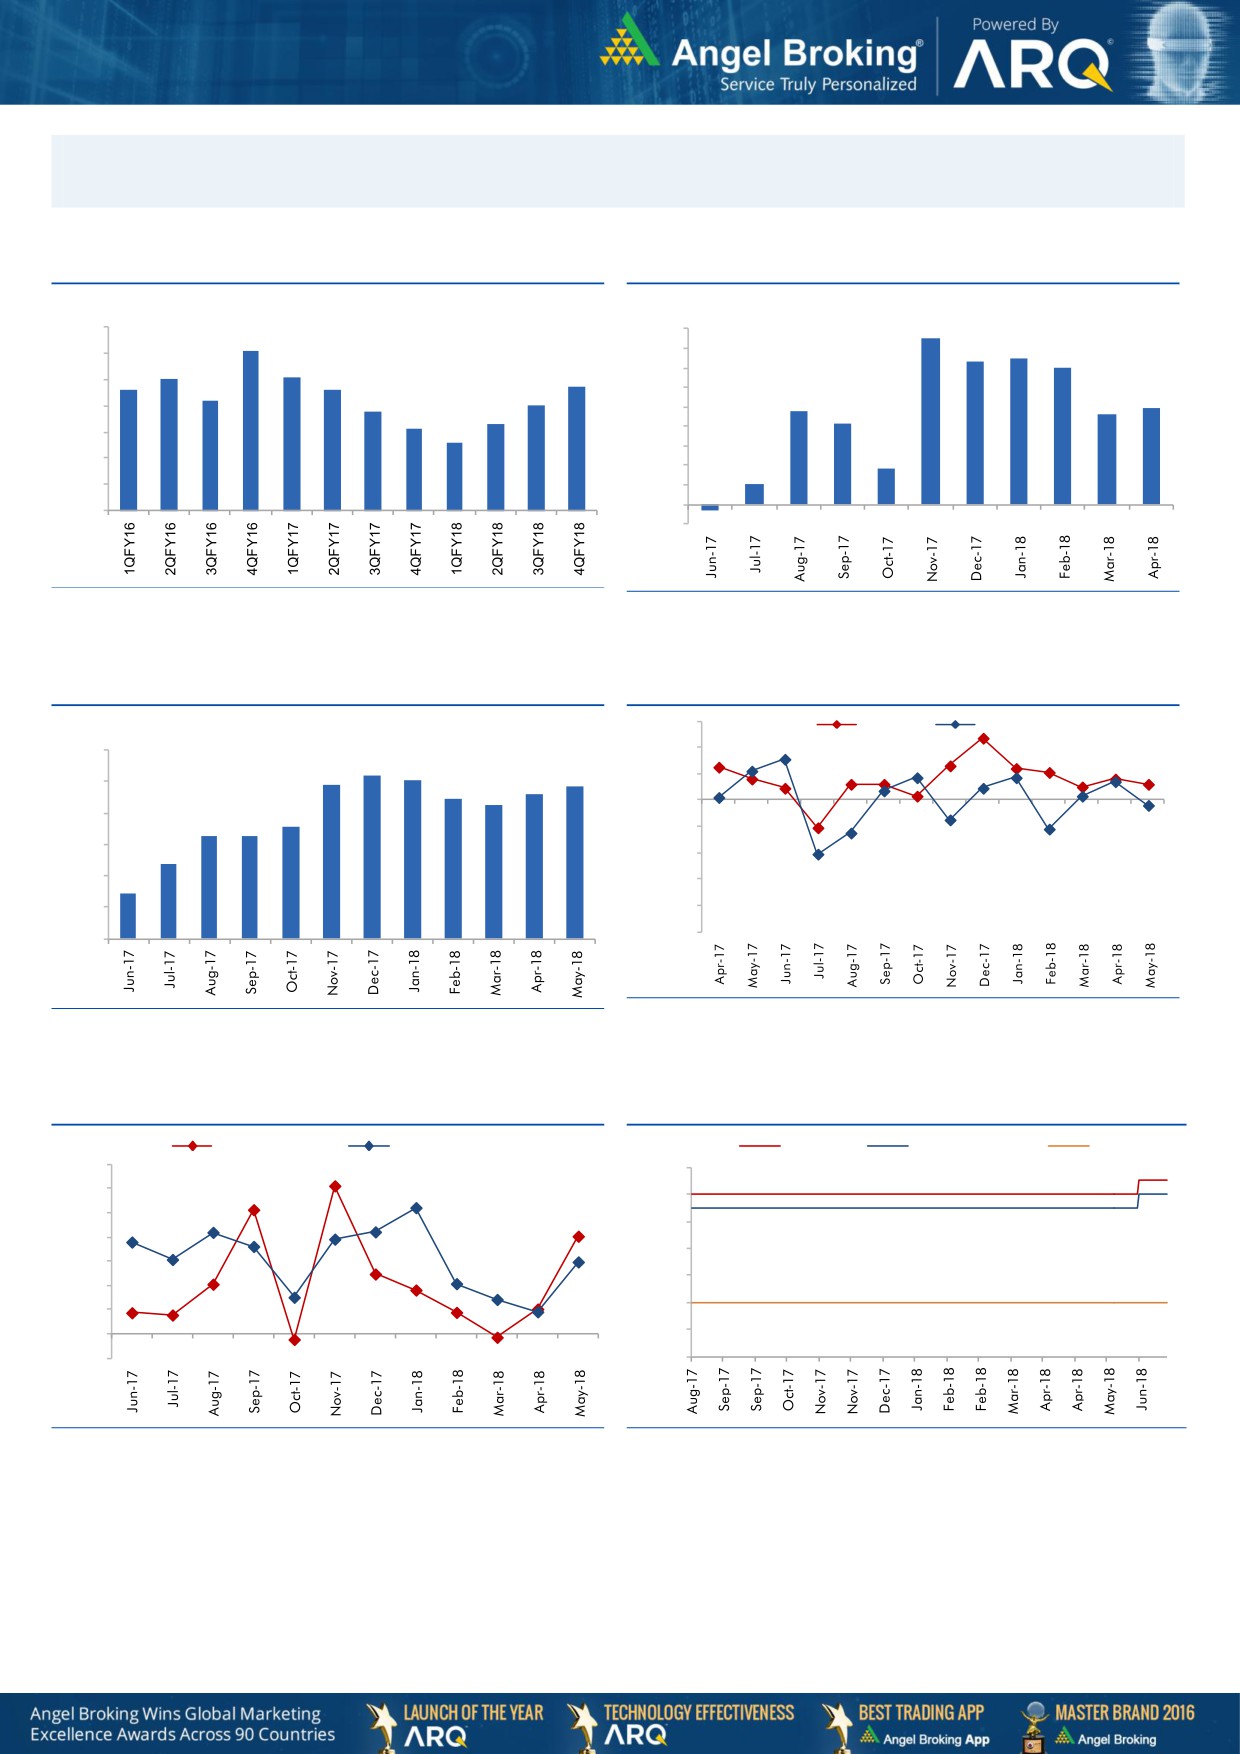
Market Outlook
July 02, 2018
Macro watch
Exhibit 1: Quarterly GDP trends
Exhibit 2: IIP trends
(%)
(%)
8.5
10.0
9.0
9.1
7.3
7.5
8.0
7.0
9.0
8.0
8.1
7.6
7.6
7.7
7.0
8.0
7.2
7.0
6.0
6.8
4.8
4.6
4.9
7.0
6.3
5.0
4.1
6.1
5.6
4.0
6.0
3.0
1.8
5.0
2.0
1.0
4.0
1.0
-
3.0
(1.0)
(0.3)
Source: CSO, Angel Research
Source: MOSPI, Angel Research
Exhibit 3: Monthly CPI inflation trends
Exhibit 4: Manufacturing and services PMI
56.0
Mfg. PMI
Services PMI
(%)
6.0
54.0
5.2
5.1
4.9
4.9
52.0
5.0
4.4
4.6
4.3
50.0
4.0
3.6
3.3
3.3
48.0
3.0
2.4
46.0
2.0
1.5
44.0
1.0
42.0
40.0
-
Source: Market, Angel Research; Note: Level above 50 indicates expansion
Source: MOSPI, Angel Research
Exhibit 5: Exports and imports growth trends
Exhibit 6: Key policy rates
(%)
Exports yoy growth
Imports yoy growth
(%)
Repo rate
Reverse Repo rate
CRR
35.0
6.50
30.0
6.00
25.0
5.50
20.0
5.00
15.0
4.50
10.0
4.00
5.0
3.50
0.0
(5.0)
3.00
Source: Bloomberg, Angel Research
Source: RBI, Angel Research
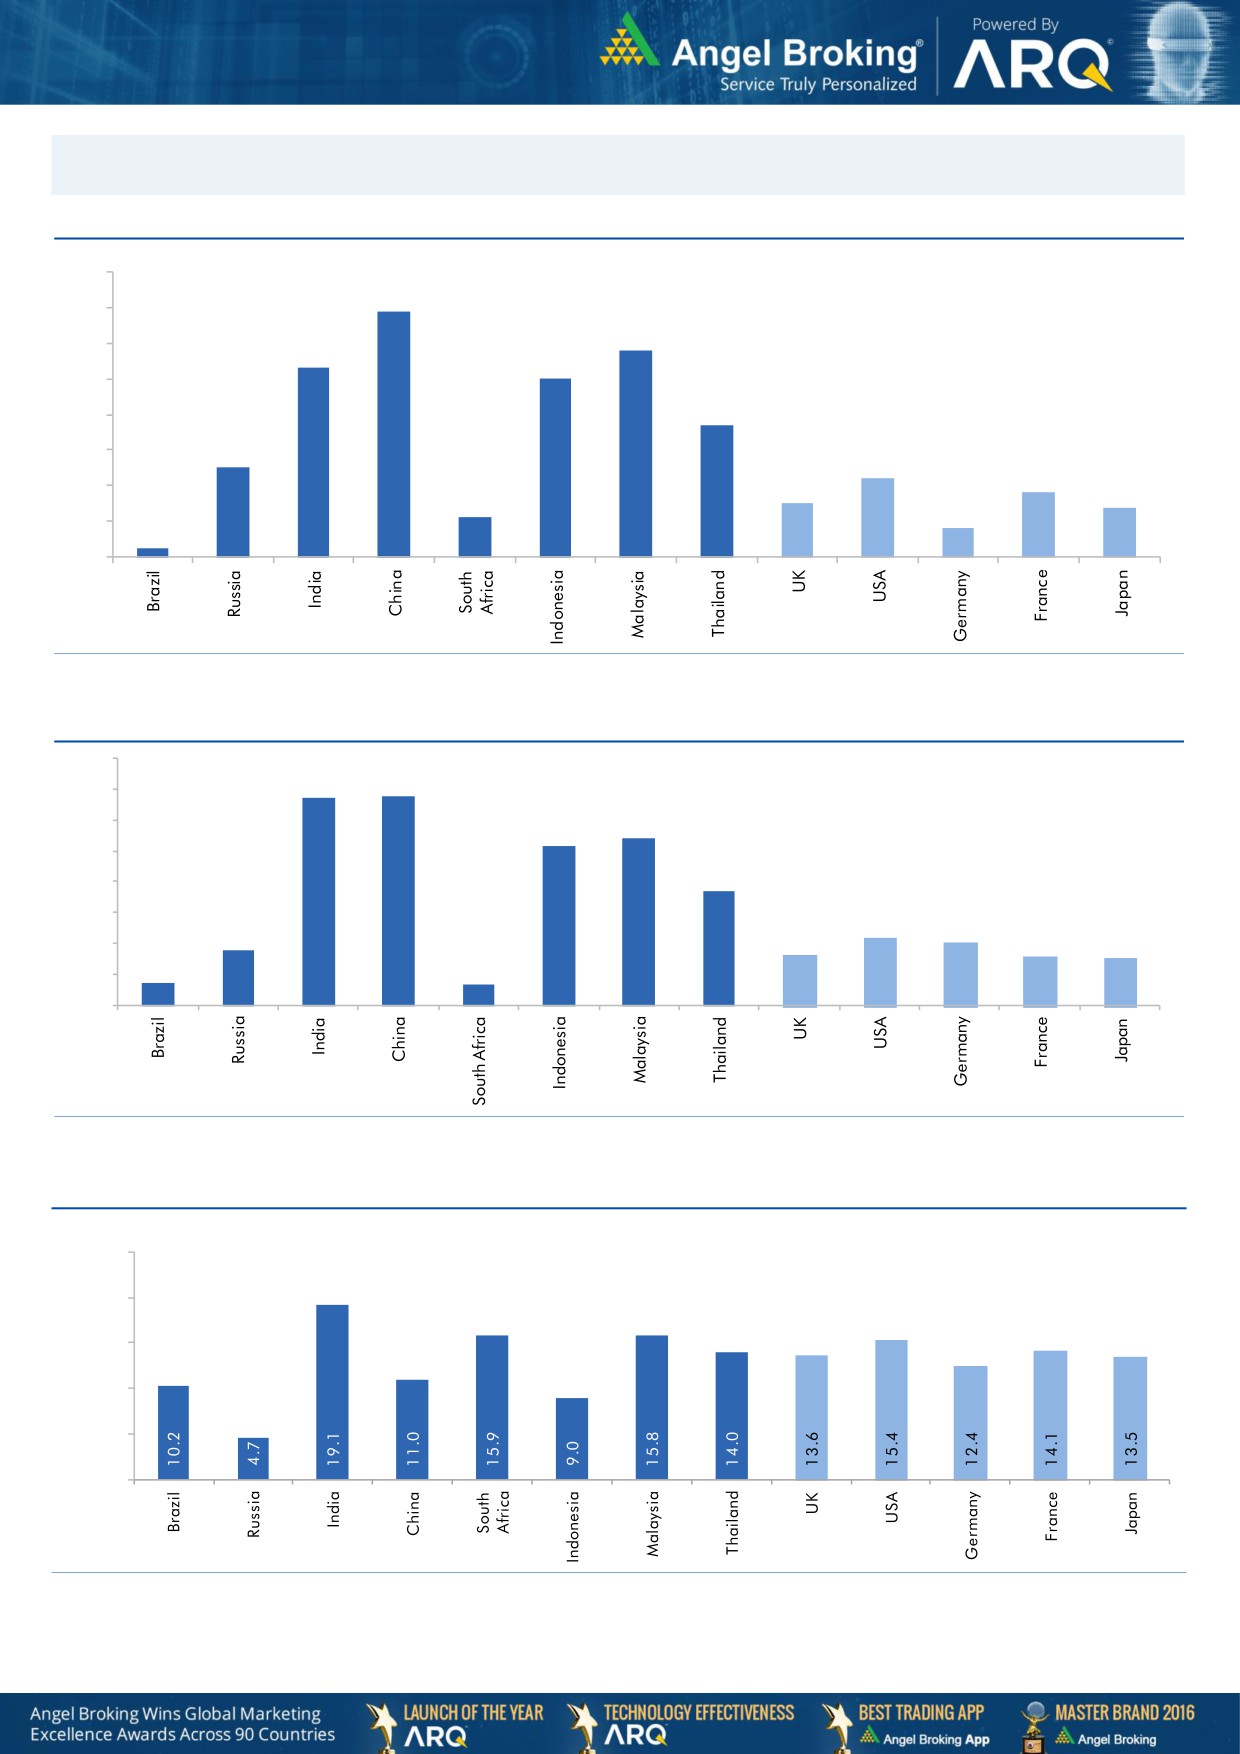
Market Outlook
July 02, 2018
Global watch
Exhibit 1: Latest quarterly GDP Growth (%, yoy) across select developing and developed countries
(%)
8.0
6.9
7.0
5.8
6.0
5.3
5.0
5.0
1.1
3.7
4.0
2.5
3.0
2.2
1.8
2.0
1.5
1.4
0.8
1.0
0.3
-
Source: Bloomberg, Angel Research
Exhibit 2: 2017 GDP Growth projection by IMF (%, yoy) across select developing and developed countries
(%)
6.7
6.8
7.0
6.0
5.4
5.2
5.0
3.7
4.0
3.0
1.8
2.2
2.0
1.7
1.6
2.0
0.7
1.5
0.7
1.0
-
Source: IMF, Angel Research
Exhibit 3: One year forward P-E ratio across select developing and developed countries
(x)
25.0
20.0
15.0
10.0
5.0
-
Source: IMF, Angel Research As on June 28, 2018
Market Outlook
July 02, 2018
Exhibit 4: Relative performance of indices across globe
Returns (%)
Country
Name of index
Closing price
1M
3M
1YR
Brazil
Bovespa
71,767
(4.8)
(14.4)
17.1
Russia
Micex
4,467
1.4
7.1
11.4
India
Nifty
10,589
0.9
5.9
12.9
China
Shanghai Composite
2,787
(8.8)
(9.1)
(9.8)
South Africa
Top 40
49,777
3.8
3.5
13.2
Mexico
Mexbol
47,031
5.3
0.5
(4.7)
Indonesia
LQ45
881
(1.9)
(12.6)
(5.2)
Malaysia
KLCI
1,666
(7.3)
(11.3)
(6.9)
Thailand
SET 50
1,051
(7.2)
(11.5)
5.9
USA
Dow Jones
24,216
(0.6)
1.5
13.8
UK
FTSE
7,616
(0.2)
10.6
4.1
Japan
Nikkei
22,270
(0.4)
4.5
10.6
Germany
DAX
12,177
(3.8)
2.7
(0.2)
France
CAC
5,276
(1.6)
4.1
3.1
Source: Bloomberg, Angel Research As on June 29, 2018
Market Outlook
July 02, 2018
Exhibit 7: Historical Angel Top Picks/Fundamental Calls
Date Added
Top Picks/Fundamental
Stocks
Reco Price
Target/Revised Price
Current Status
20-06-2018
Top Picks
Shriram Transport Finance Com
1,466
1,764
Open
01-07-2018
Top Picks
Bata India
862
948
Open
18-06-2018
Top Picks
Bata India
779
896
14-06-2018
Top Picks
Amber Enterprises
1,026
1,230
Open
07-06-2018
Top Picks
M&M
918
1050
Open
04-05-2018
Top Picks
M&M
860
990
03-05-2018
Fundamental
L&T Finance Holding
171
210
Open
02-05-2018
Top Picks
HDFC Bank
1944
2315
Open
04-05-2018
Top Picks
Matrimony.com Ltd
810
1016
Open
20-04-2018
Top Picks
Matrimony.com Ltd
781
984
15-05-2018
Top Picks
Parag Milk Foods Limited
310
410
Open
16-04-2018
Top Picks
Parag Milk Foods Limited
249
333
29-06-2018
Fundamental
GMM Pfaudler Limited
932
1,020
Open
14-05-2018
Fundamental
GMM Pfaudler Limited
818
900
06-04-2018
Fundamental
GMM Pfaudler Limited
712
861
07-03-2018
Fundamental
Ashok Leyland Ltd
139
163
Closed (26/04/2018)
03-03-2018
Fundamental
Greenply Industries
340
395
Open
16-04-2018
Top Picks
Safari Industries
651
750
Open
21-02-2018
Top Picks
Safari Industries
532
650
31-05-2018
Top Picks
HSIL Ltd
348
Closed (31/05/2018)
16-02-2018
Top Picks
HSIL Ltd
433
510
07-02-2018
Fundamental
Elantas Beck India Ltd.
2155
2500
Open
01-02-2018
Top Picks
ICICI Bank
352
416
Open
01-02-2018
Top Picks
Aditya Birla Capital
167
218
Open
04-01-2018
Fundamental
CCL Products
278
360
Open
03-01-2018
Fundamental
Nilkamal Ltd
1880
2178
Open
01-01-2018
Fundamental
Capital First Ltd
693
850
Closed (15/01/2018)
30-12-2017
Fundamental
Shreyans Industries Ltd
205
247
Closed
Fundamental
Prism Cement Ltd
160
Closed (09/05/2018)
21-12-2017
Fundamental
Prism Cement Ltd
118
131
18-12-2017
Fundamental
Menon Bearings Limited
92
114
Closed (17/01/2018)
14-12-2017
Top Picks
Ruchira Papers Ltd.
188
244
Closed (09/02/2018)
17-05-2018
Top Picks
Century Plyboards India
280
Closed(17/05/2018)
28-11-2017
Top Picks
Century Plyboards India
317
400
19-12-2017
Top Picks
LT Foods
85
Closed(18/06/2018)
06-11-2017
Top Picks
LT Foods
74
96
16-10-2017
Fundamental
Endurance Technologies Ltd
1111
1277
Closed (01/12/2017)
11-09-2017
Top Picks
GIC Housing
533
655
Open
10-10-2017
Top Picks
Music Broadcast Limited
404
475
Open
20-07-2017
Top Picks
Music Broadcast Limited
368
434
07-07-2017
Fundamental
L&T Finance Holdings Ltd
149
179
Closed (28/8/2017)
06-07-2017
Fundamental
Syngene International
478
564
Closed (1/3/2018)
05-07-2017
Top Picks
Maruti
7371
10619
Open
05-06-2017
Top Picks
Karur Vysya Bank
127
100
Closed (12/03/2018)
23-05-2018
Top Picks
KEI Industries
481
589
Open
Source: Company, Angel Research
Market Outlook
July 02, 2018
Exhibit 8: Historical Angel Top Picks/Fundamental Calls
Date Added
Top Picks/Fundamental
Stocks
Reco Price
Target/Revised Price
Current Status
04-01-2017
Top Picks
KEI Industries
125
485
31-05-2018
Top Picks
Alkem Lab
1978
Closed (31/05/2018)
01-12-2016
Top Picks
Alkem Lab
1700
2441
17-10-2016
Top Picks
Asian Granito
267
534
Closed (18/02/2018)
17-05-2018
Top Picks
TV Today Network
460
Closed (17/05/2018)
04-08-2016
Top Picks
TV Today Network
297
603
05-04-2016
Top Picks
DHFL
189
720
Open
25-06-2018
Top Picks
Navkar Corporation
207
Closed(25/06/2018)
05-01-2016
Top Picks
Navkar Corporation
207
265
Open
08-12-2015
Top Picks
Blue Star
357
867
Open
30-10-2015
Top Picks
Siyaram Silk Mills
186
851
Open
Source: Company
Market Outlook
July 02, 2018
Research Team Tel: 022 - 39357800
DISCLAIMER
Angel Broking Private Limited (hereinafter referred to as “Angel”) is a registered Member of National Stock Exchange of India
Limited,Bombay Stock Exchange Limited and Metropolitan Stock Exchange Limited. It is also registered as a Depository Participant with
CDSL and Portfolio Manager with SEBI. It also has registration with AMFI as a Mutual Fund Distributor. Angel Broking Private Limited is
a registered entity with SEBI for Research Analyst in terms of SEBI (Research Analyst) Regulations, 2014 vide registration number
INH000000164. Angel or its associates has not been debarred/ suspended by SEBI or any other regulatory authority for accessing
/dealing in securities Market. Angel or its associates/analyst has not received any compensation / managed or co-managed public
offering of securities of the company covered by Analyst during the past twelve months.
This document is solely for the personal information of the recipient, and must not be singularly used as the basis of any investment
decision. Nothing in this document should be construed as investment or financial advice. Each recipient of this document should
make such investigations as they deem necessary to arrive at an independent evaluation of an investment in the securities of the
companies referred to in this document (including the merits and risks involved), and should consult their own advisors to determine
the merits and risks of such an investment.
Reports based on technical and derivative analysis center on studying charts of a stock's price movement, outstanding positions and
trading volume, as opposed to focusing on a company's fundamentals and, as such, may not match with a report on a company's
fundamentals. Investors are advised to refer the Fundamental and Technical Research Reports available on our website to evaluate the
contrary view, if any.
The information in this document has been printed on the basis of publicly available information, internal data and other reliable
sources believed to be true, but we do not represent that it is accurate or complete and it should not be relied on as such, as this
document is for general guidance only. Angel Broking Pvt. Limited or any of its affiliates/ group companies shall not be in any way
responsible for any loss or damage that may arise to any person from any inadvertent error in the information contained in this report.
Angel Broking Pvt. Limited has not independently verified all the information contained within this document. Accordingly, we cannot
testify, nor make any representation or warranty, express or implied, to the accuracy, contents or data contained within this document.
While Angel Broking Pvt. Limited endeavors to update on a reasonable basis the information discussed in this material, there may be
regulatory, compliance, or other reasons that prevent us from doing so.
This document is being supplied to you solely for your information, and its contents, information or data may not be reproduced,
redistributed or passed on, directly or indirectly.
Neither Angel Broking Pvt. Limited, nor its directors, employees or affiliates shall be liable for any loss or damage that may arise from
or in connection with the use of this information.